APS demo results: what does 91% on-time delivery mean?
Read delivery, load and changeover metrics from an existing FlexScheduler demo screenshot. This is fictional demonstration data, not a customer production study or a before-and-after improvement benchmark.
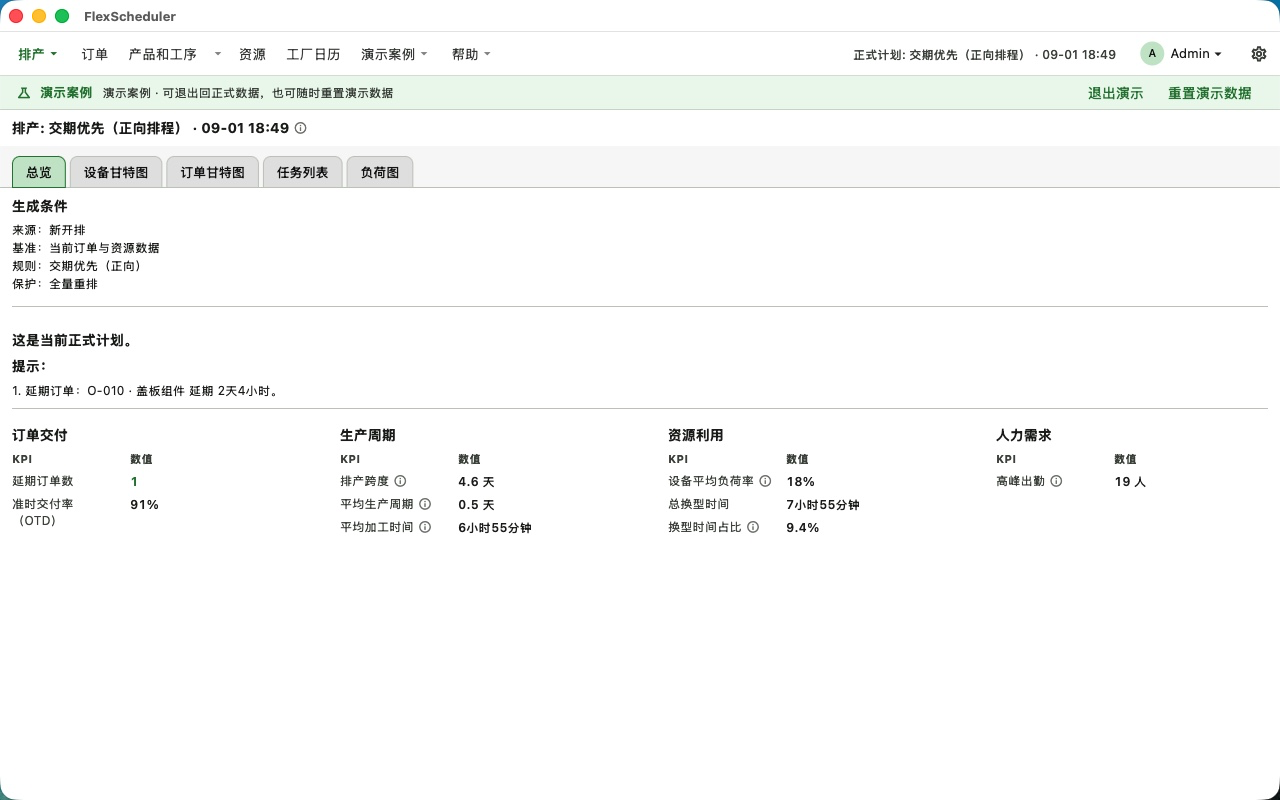
Results visible in the screenshot
| Item | Value or condition |
|---|---|
| Primary rule | Due-date priority, forward scheduling |
| Late orders | 1 |
| On-time delivery (displayed) | 91% |
| Schedule span | 4.6 days |
| Average lead time | 0.5 days |
| Average processing time | 6h 55m |
| Average machine load | 18% |
| Total changeover | 7h 55m |
| Changeover share | 9.4% |
| Peak staffing | 19 people |
A late order remains for the planner to review
The screenshot shows order O-010, Cover Plate Assembly, approximately 2 days and 4 hours late. A 91% on-time rate does not mean all orders finish on time; review the order routing, resources and due date.
Low load alone does not determine schedule quality
18% is the value shown for this demo. Interpret it alongside the reporting horizon, shift calendars and individual machine loads; it cannot establish a customer factory utilization rate or improvement.
Evidence limits
This page transcribes an archived screenshot. It does not include a complete input snapshot or a rerun of that plan. It shows how the software presents a result with a late order; it does not prove optimality or promise a fixed benefit.